WrPMIP Regional Simulations (Phase 1)
| Phase | Experiment | Input | Historical 1901-2021 |
Future 2021-2100 |
Extended 2100-2300 |
|---|---|---|---|---|---|
| 1 | a. Regional Baseline (low temporal resolution) | Climate, CO2 | CRUJRA (1901-2000) | Not simulated | Not simulated |
| b Regional baseline (high temporal resolution) | Climate, CO2 | CRUJRA (2000-2021) | Not simulated | Not simulated | |
| c. Regional OTC Warming | Climate, CO2 | CRUJRA (2000-2021) | Not simulated | Not simulated | |
| d. Regional Snow Fence Warming | Climate, CO2 | CRUJRA (2000-2021) | Not simulated | Not simulated |
Regional Simulation (Phase 1)
At the regional scale we plan to look at model agreement for permafrost extent and ecosystem carbon fluxes and abiotic variables in response to warming. This will facilitate an assessment of uncertainty across models, space, and time using functional benchmarks and ILAMB assessments (still in development). As an important baseline, control and perturbation runs at the regional scale can then be compared to future site-level simulations for model ensemble uncertainty and coherence between perturbation responses and anthropogenic climate change across scale. The variables of interest are listed here: WrPMIP Model Submission Information.
General approach for regional WrPMIP simulations:
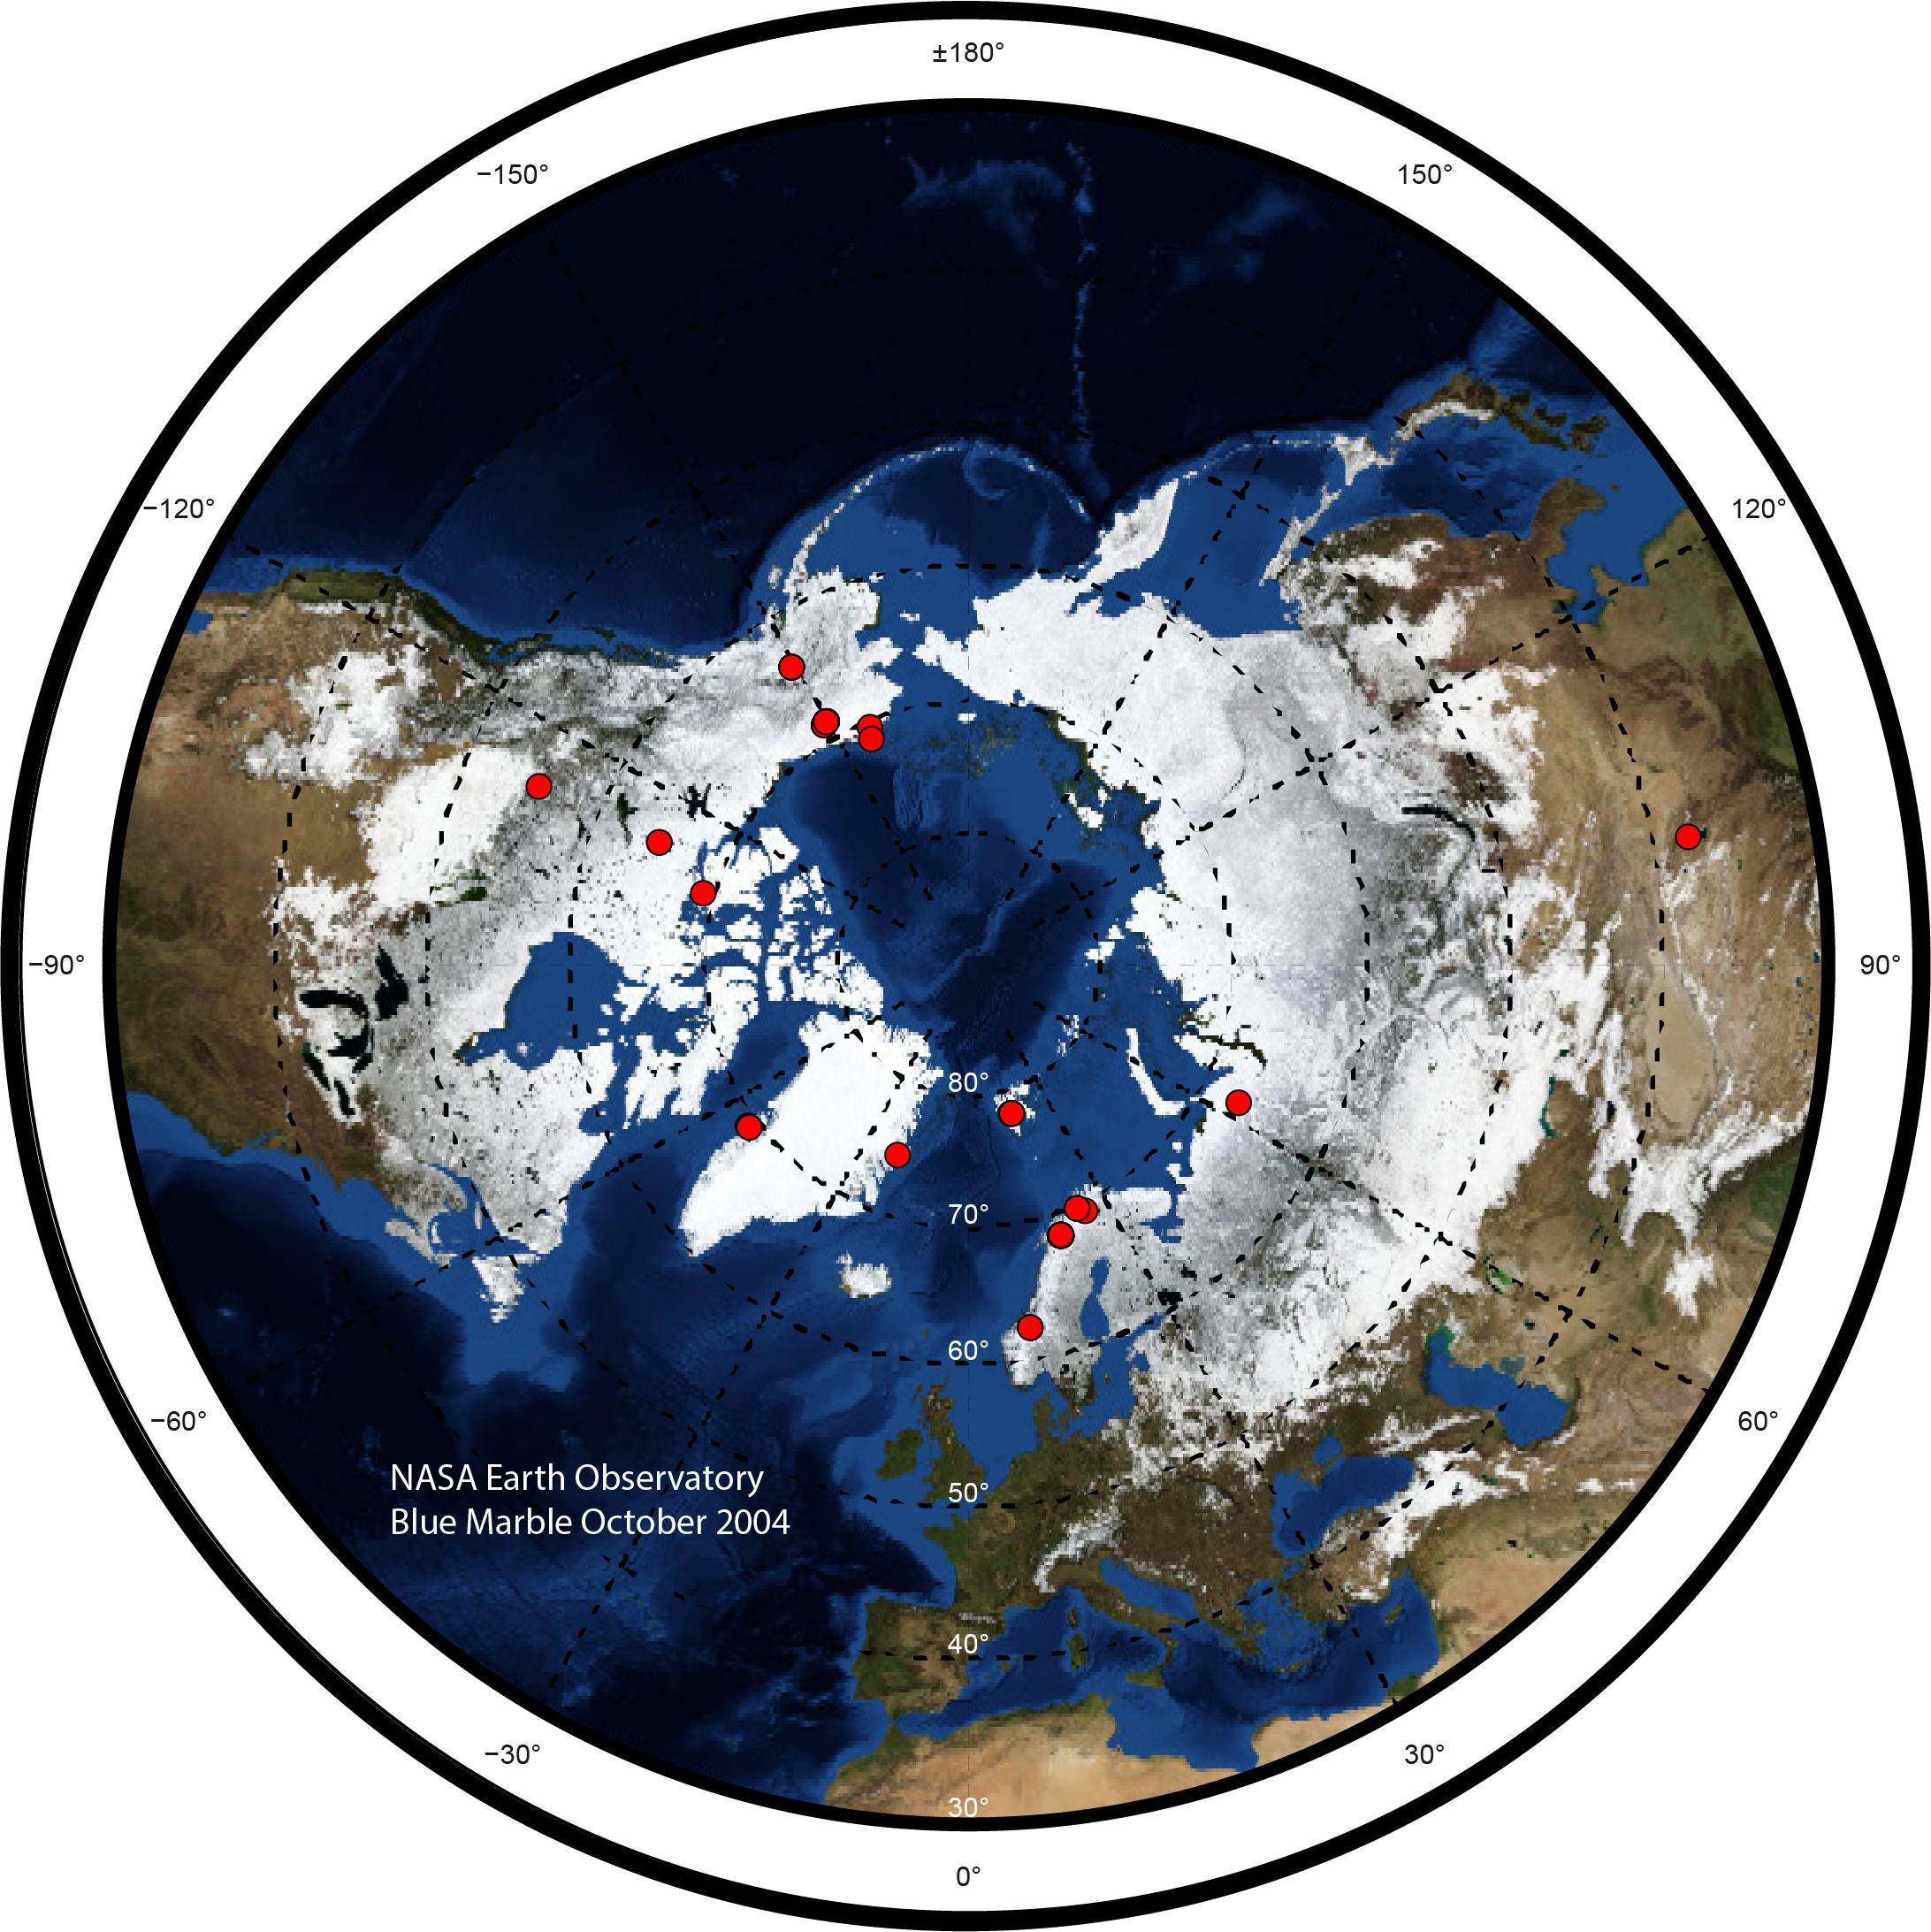
- Simulated the Pan-Arctic from 55N at 0.5-degree gridding.
- Used the CRUJRAv2.3 climate forcing reanalysis product.
- Models spun-up at 1901 using recycled 1901-1920 climate forcing.
- Transient simulation from 1901-2000 with output at monthly or yearly timestep.
- Three simulation restarts from 2000-01-01 to 2021-12-31 with output at daily timestep:
- Baseline simulation, no manipulation.
- Open Top Chamber (OTC) warming.
- Snow Fence (SF) warming.
For OTC warming we manipulated the aerodynamic resistances in the plant canopy over the summer (May – September), while for SF warming we manipulated the insulating capacity of snow over the winter (October – April). For OTC warming, using CLM5 specifically, we increased the aerodynamic resistance of sensible heat (Rah) and water vapor (Raw) by the same factor. For SF warming, using CLM5 specifically, we decreased the thermal conductivity of all snow layers by the same factor.
Warming Targets (55N mean across grids):
- Open top chamber (OTC):
- 0.5 °C summer mean 10cm soil temperature increase (main target)
- 1 °C (0.5 – 1.5 °C range) summer mean vegetation/canopy temperature increase
- Snow fence (SF):
- 1.5 – 3.0 °C winter mean 10cm soil temperature increase